How to Choose Fine Aluminum Powder for Industrial Use?
Choosing Fine Aluminum Powder is not a catalog exercise. Particle size, shape, purity, surface condition, and flow behavior can affect dosing, coating quality, compaction, and consistency. A powder that pours smoothly into a small hopper may still perform poorly in a finished part. Small differences matter.
The International Aluminium Institute reported approximately 70.6 million tonnes of global primary aluminum production in 2023. That figure shows the scale of the aluminum industry, not the size of the fine-powder market. Buyers still need product-specific evidence. Compare particle-size distributions, certificates of analysis, and batch-to-batch data. ASTM methods such as B213 for flow rate and B214 for sieve analysis can support meaningful comparisons, where applicable. Check the test method, not only the headline specification.
Powder-metallurgy expert Randall M. German’s published work highlights the importance of matching powder characteristics to the manufacturing process. A practical paraphrase of that principle is: “Choose the powder for the process, not the product name.” This is not a verbatim quotation. It is a useful reminder. Ask suppliers how they measure particle size, control moisture, and verify consistency. Review safety data and handling guidance before qualification. That step is easy to overlook. So is checking whether the sample represents routine production. A careful selection process should weigh performance, documentation, supply reliability, and total operating cost—not just price per kilogram.
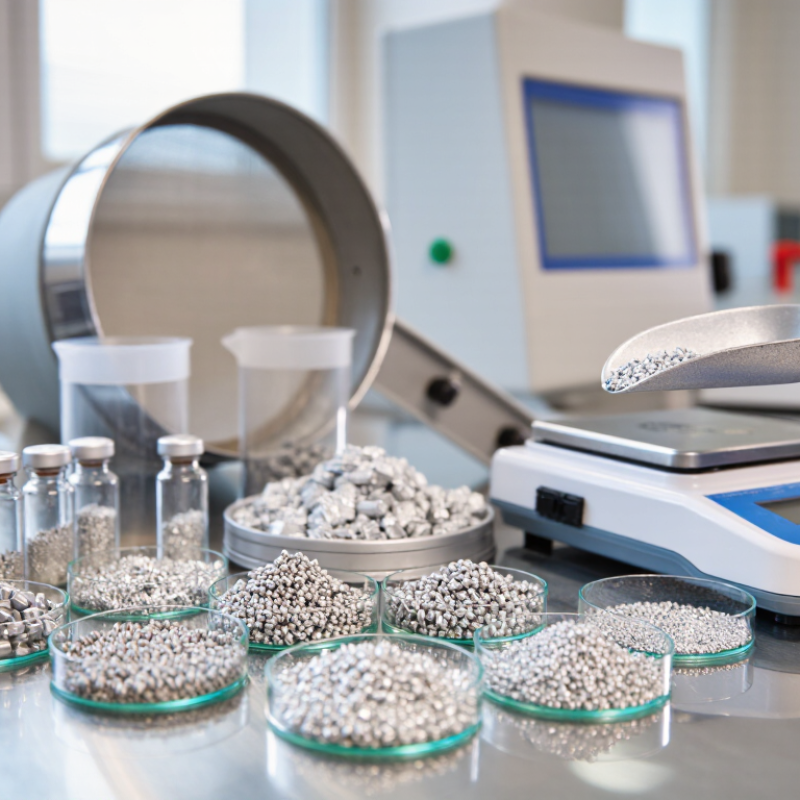
Define Particle-Size Targets with D10, D50, D90, and ASTM B214
Choosing fine aluminum powder starts with the process, not a catalog label. Set a target range that matches the required flow, packing, or surface finish. D10 marks the size below which 10% of measured particles fall; D50 is the median, and D90 marks the point below which 90% fall. These values reveal more than an average alone. For example, a suitable D50 can still hide an unwanted coarse tail that affects a thin coating or a narrow feed system.
Ask how the distribution was measured. D10, D50, and D90 are commonly reported from particle-size analysis, while ASTM B214 provides a sieve-analysis method for metal powders. The methods do not produce interchangeable results. Sieving can help identify retained coarse fractions, but very fine particles or agglomerates may complicate interpretation. Request the method, sample preparation details, and test report with each specification. Small details matter.
Compare results using the same procedure and check batch-to-batch variation, not just one attractive data sheet. A powder with a broad distribution may pack differently from a tighter distribution, even when both share the same D50. There is no universal ideal. One easy-to-miss issue is that handling can change how particles appear to group together. A neat specification still cannot describe every batch behavior; verify it against the actual process before setting acceptance limits.
Compare Aluminum Purity, Oxide Content, and Alloy Chemistry by Grade
Fine aluminum powder selection starts with the certificate of analysis, not the grade name. Compare aluminum purity with limits for iron, silicon, and copper; small differences can affect conductivity, sintering, or coating performance. Match alloy chemistry to the process and end-use requirements. A high-purity grade is not automatically the best choice. USGS’s 2025 Mineral Commodity Summaries estimated 2024 global primary aluminum production at about 72 million metric tons. That figure describes bulk metal supply, not powder consistency, so request lot-specific results.
Oxide content deserves separate attention. A purity result may not reveal how much oxygen is present at particle surfaces, where it can influence wetting and bonding. Ask suppliers for oxygen or oxide test methods, particle-size distribution, and batch traceability. ASTM B214 describes sieve analysis for metallic powders; it helps assess size distribution, but does not measure oxide content. One detail often gets missed. Fine powders with similar chemistry can behave differently if their particle shapes or size ranges differ.
Tips: Compare certificates from multiple lots, not just one sample. Confirm the analytical method and reporting units for oxygen, then test a representative sample against your process. Be candid about uncertainty: supplier data may not predict performance in your equipment. Keep the specification tied to measurable limits, and review it when the application changes.
How to Choose Fine Aluminum Powder for Industrial Use
Compare aluminum purity, oxide content, and alloy chemistry by grade. The chart shows representative midpoint alloying-element contents for common alloy chemistries, in weight percent.
How to interpret: Values are approximate midpoints of commonly specified composition ranges for the named alloys, not guaranteed powder-lot analyses. Alloy designation does not specify powder purity or oxide content. Request a lot-specific chemical analysis and an appropriate oxide or oxygen test, and confirm limits against the applicable material specification and your process requirements.
Verify Flow and Apparent Density Using ASTM B213 and B212
Fine aluminum powder should be screened with repeatable tests, not judged by appearance alone. ASTM B213 measures flow time through a Hall funnel, typically using a 50 g sample. Record the result in seconds and note any bridging or interrupted flow. A smooth stream is useful, but it does not prove consistent feeding on a production line.
Pair that result with apparent density under ASTM B212. The method uses a calibrated 25 cm³ cup to assess how much powder settles into a fixed volume. Report density in g/cm³, alongside sample condition and test temperature. Compare lots using the same funnel, cup, filling technique, and handling steps; even small differences can shift the readings. Repeat measurements help reveal variability. Not perfect, but informative.
Read both values together. A powder may flow quickly yet pack loosely, changing feeder output by volume. Conversely, higher apparent density does not guarantee trouble-free discharge. For purchasing checks, define acceptable ranges from trials on the actual hopper and feeder, then verify incoming lots against those limits. ASTM B213 and B212 provide standardized methods, not universal pass-or-fail thresholds. Record clumps, dust, and pauses too; these details can matter, though operators sometimes overlook them.
How to Choose Fine Aluminum Powder for Industrial Use? — Verify Flow and Apparent Density Using ASTM B213 and B212
Example screening dataset for comparing representative aluminum powder lots. Flow time is reported in seconds per 50 g using ASTM B213; apparent density is reported in g/cm³ using ASTM B212.
| Sample | Nominal Particle Size | Particle Shape | ASTM B213 Flow Time (s/50 g) | ASTM B212 Apparent Density (g/cm³) | Practical Selection Note |
| Lot A | 20–45 µm | Mostly spherical | 36 | 0.92 | Fine particle size may suit applications needing a finer feed, but confirm that the measured flow is adequate for the equipment. |
| Lot B | 45–75 µm | Spherical | 28 | 1.05 | Balanced example for processes where both metering consistency and a moderate particle size are important. |
| Lot C | 75–150 µm | Spherical | 22 | 1.18 | Faster flow and higher loose-fill density in this example; check that the coarser size meets the final product requirements. |
| Lot D | 20–45 µm | Irregular | Does not flow | Not determined | ASTM B213 flow time cannot be reported when the powder does not pass through the test funnel. Assess with a method appropriate to the intended process. |
How to use the results: Compare flow time and apparent density with the requirements of the specific feeding, conveying, or forming process. ASTM B213 measures Hall-funnel flow rate, while ASTM B212 measures apparent density using a Hall flowmeter funnel; neither result alone establishes suitability or a universal pass/fail limit. The values above are illustrative examples, not certified test results or acceptance limits. Confirm lot-specific results with a qualified laboratory and follow the current ASTM procedures.
Match Particle Morphology and Surface Area to the Production Process
Choosing fine aluminum powder starts with the production process, not a “finer is better” target. Spherical particles generally flow and feed more consistently. Flakes or irregular particles may provide greater coverage in some coatings, but can bridge in hoppers or disperse unevenly. Small differences matter.
Higher BET surface area can improve contact and reaction rates. It may also increase binder demand, oxidation sensitivity, and dust-control requirements. For thermal spray or pressed components, compare morphology, particle-size distribution, apparent density, and surface area together. Ask for measured values and test methods; “fine” grades may not be directly comparable.
Validate the powder on the actual equipment. Check feeder stability, mixing time, coating coverage, and finished-part consistency across multiple batches. A bench test can mislead. Humidity, handling, and line speed can change performance. Keep powder dry and follow the supplier’s safety data and site dust-control procedures, since fine aluminum dust can ignite. If flow is poor, particle size may not be the only cause; morphology or storage conditions could matter more.
Require Sample-Specific Kst Testing; Aluminum Dust Can Exceed 300 bar·m/s
How to Choose Fine Aluminum Powder for Industrial Use?
Fine aluminum powder should be selected by its measured properties, not by a generic grade description. The key safety value is Kst, which describes how rapidly dust-explosion pressure rises. IFA’s GESTIS-DUST-EX database contains aluminum-dust test results around 500 bar·m/s, well above the 300 bar·m/s threshold associated with the highest dust-explosion class, St 3. These figures are not a prediction for every powder. Particle size, moisture, shape, surface condition, and test concentration can change the result. Small details matter.
Require a current Kst report for the exact material and, where practical, the supplied lot. ASTM E1226 provides a recognized method for measuring dust-cloud explosion pressure and pressure-rise rate. A supplier’s result for a coarser or older sample may not represent the fine powder arriving at your plant. Ask for the tested particle-size distribution and moisture content alongside Kst and maximum explosion pressure, Pmax. Check that the report identifies its test method and sample preparation. Then compare the data with your process conditions, including transfer points where dust can become airborne. A neat certificate is helpful, but it cannot replace representative testing. That distinction is easy to miss.